 EPIMAP
 Easily visualize more than 130.000 roman inscriptions in time and space

This data comes from the Clauss-Slaby's public repository
that stores a "data base that records almost all Latin inscriptions". Original data consists of a bit more
than 500.000 latin inscriptions. From there, we selected the subset that contains both GPS coordinates and datation.
The resulting corpus contains 135.000 inscriptions. In addition to the position and datation of the inscriptions, the
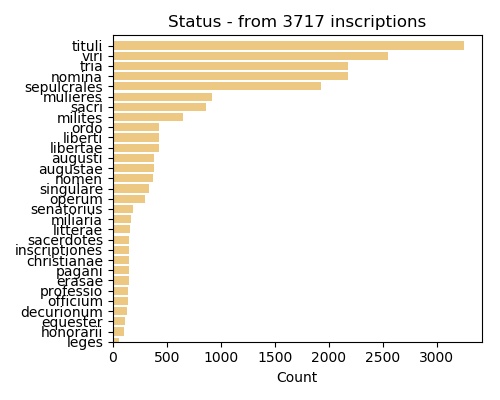
data also consists of the inscriptions themselves and the reported status of the owner of the inscription -which allows
for filtering. The lower date has been systematically shifted of 40 years (life expectancy in ancient Rome) as a broad estimate
of the time the person lived before the inscription appeared. While being more intuitive, this also allows the very
well dated inscriptions to appear in the corpus for at least 40 years -which is still considered a very localized datation.
Last update of the dataset: 14/10/2020
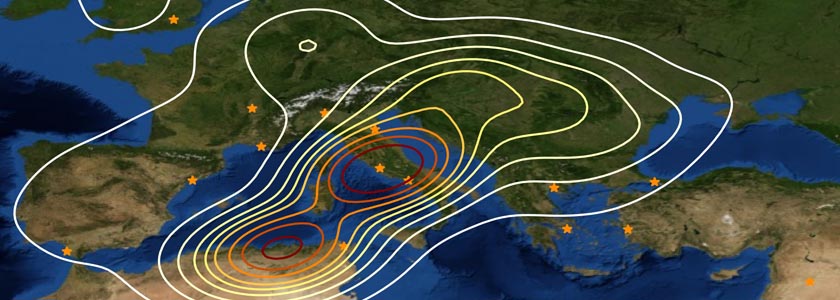
This tool has been designed for research purposes, allowing scientists to easily and quickly explore the Clauss-Slaby dataset and
perform analysis that would not had been doable manually. In this optic, a number of tunable parameters are provided in the interface.
The results provided by the tool can be freely used in academical context -referencing this tool's address tool while doing so being a
nice payback :)
In addition, a draft of quantitative measurements is provided in the results section. To this date:
Try using the following form, or directly address the message to epimap.webapp@gmail.com